Data-Driven Storytelling for Executives
Learn how to use data more effectively to align, inspire and motivate your team.
Why is storytelling so effective?
Since the early days of civilization, humans have used stories as our primary tool for communicating information. Today, although modern technology has changed the method and means of communication, stories remain a central aspect of the human experience. They are one of our primary tools for teaching, learning and fostering cooperation.
Understanding why stories are so effective comes down to neuroscience. Stories activate the sensory cortexes in your brain, releasing oxytocin and cortisol. These chemicals cause you to connect to the story: identifying with the narrator, translating the story into relatable contexts, and remembering it for a long time after.
Given that humans respond to stories better than any other form of information, it makes sense stories and storytelling skills are valuable in a business setting. This is particularly true when it comes to communicating with data. Data-driven storytelling is a powerful strategy used by executives to communicate data in a way that motivates their employees, fosters internal alignment and drives action.
You can have the richest dataset in the world, but it’s all just a bunch of numbers until you format and deliver it in a way that captures your team’s attention and moves them. That’s why many executives today are turning to Data Story Academy to improve their ability to communicate with data and evolve from delivering simple statistics to delivering stories that inspire data-driven action.
Learn expert techniques for data-driven storytelling.
In a world where we are surrounded by information, data storytelling helps you connect the dots. Built for executives and data leaders, Data Story Academy’s three-part foundational course equips you with skills and strategies to become a more compelling data-driven storyteller.
What are people saying?

Deb Hawkins | Senior Analyst, ECommerce Data & Analytics
"Hi Zack, I just watched your courses and have to say they were fantastic . . . because how often do you actually find courses worth watching?! It's very rare. The title of the email I sent to my boss and co-workers was “It’s like finding a unicorn!” Thank you for the valuable insights!"

Christina Stathopoulos | Data Expert at Google, Professor - IE Business School
"The Data Story Academy courses are wonderful material for any professional wanting to gain core skills when it comes to communicating with data. A key for businesses today is making sense of all the data at hand, and proper data visualization is one of the best ways to do just that. These courses help you learn how best to present your data, showing a huge amount of information in minimal space and making sure to get your point across. Highly recommended!"

Langley Payton | Master's in Engineering, High School Geometry Teacher
"Data Story Academy has been paramount in giving me the tools I need to develop visualization and presentation techniques. Zack is a great coach who offers valuable insights into these skills. I am eager to take these insights from his own experience and use them to develop professionally into my own data visualization career."
Through Data Story Academy, you’ll learn how to:
1. Use your companies goals to uncover the most important stories in your data.
The sheer amount of data available can make it hard for you to determine what information matters most in designing your data story. However, through Data Story Academy’s Blueprint course module, you’ll learn a five-step process to connect your company’s goals, the data available to you, and -- most importantly -- your audiences’ needs, to design a data-driven story that will enlighten and align your team around an objective.
2. Use questions to guide your data visualizations and deliver insights that inspire
At the heart of every chart, graph or any other type of data visualization is a question. Or, it should be that way, at least.
Oftentimes, executives will jump right into plotting data onto graphs and stuffing numbers into charts without ever pausing to think about the questions they’re trying to answer. Thorugh Data Story Academy’s second course module, The Canvas, you’ll learn principles for selecting the right data visualization and for structuring your data-driven story in a way that is clear and intuitive.
3. Spend less time explaining why, and instead speed up time to action.
Operating at today’s speed of business requires using data, creating alignment and taking decisive action, quickly. But that’s a lot easier said than done. This is particularly true for executives who are used to simply providing directives to their team, but are now tasked with the challenge of leading through concensus-building and alignment.
Through Data Story Academy’s third course module, The Story, you’ll learn how to structure and deliver a data-driven story that answers the questions of who, what, where, when, why, how, and what’s next—thus, captivating and moving your team to action, together.

BECOME A DATA STORYTELLING EXPERT
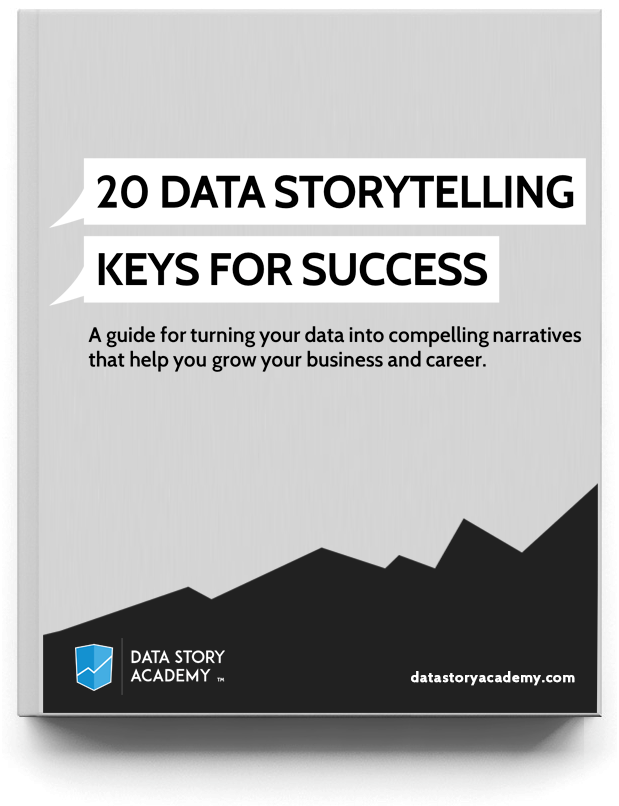
The 20 Data Storytelling Keys for Success is your guide to understanding and developing data storytelling skills of your own. These keys are often what separates a clear message or data story from a confusing one.

About the Author
Zack Mazzoncini is the Founder of Data Story Academy and a Co-Founder of Seattle-based data and analytics firm Decisive Data. Over the years Zack has helped hundreds of organizations and individuals develop data-driven cultures centered around data storytelling. Zack graduated from the University of Washington with a degree in communications, rhetoric, and public speaking. He is considered one of the most entertaining and informative speakers in the analytics industry. Zack has helped numerous organizations—including Nike, Amazon, Starbucks, Google, TD Ameritrade, and Kaiser Permanente.
If your visualizations are confusing,
no one will pay attention.
Buy Data Story Academy to begin your journey toward becoming a better data storyteller.
Get Access COURSES PREVIEW
© 2021 Data Story Academy ™ LLC


